Halogen bonds are less familiar cousins to hydrogen bonds. They are defined as non-covalent interactions (NCI) between a halogen atom (X, acting as a Lewis acid, in accepting electrons) and a Lewis base D donating electrons; D….X-A vs D…H-A. They are superficially surprising, since both D and X look like electron rich species. In fact the electron distribution around X-X (A=X) is highly anisotropic, with the electron rich distribution (the "donor") being in a torus encircling the bond, and an electron deficient region (the "acceptor") lying along the axis of the bond.
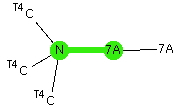
I will start this simple exploration of halogen bonds by a crystal structure search, defined as below, where A in the above definition is also any halogen, the donor D is a tri-alkyl nitrogen donating via a lone pair, the green contact is defined as an intermolecular distance equal to or shorter than the sum of the van der Waals radii together with an angle subtended as N…7A…7A.
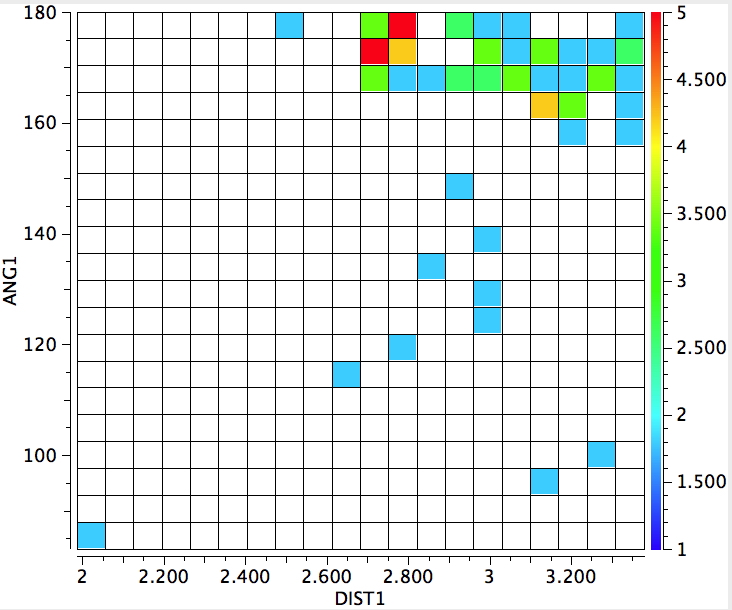
The result of such a search is shown below:

There are surprises.
-
The sparsity of hits. If the search is repeated with A = N, O or S, only six further hits are obtained, all with A=N and X=I with one example of X=Br.
-
There is a hot-spot at an N…I distance of 2.37Å, a massive 1.2Å shorter than the combined van der Waals radii of N and I, and with a linear N…I-I angle.
This next search replaces A with a carbon instead of a halogen. The hot-spot moves to ~2.8Å, still much shorter than the combined van der Waals radii, and there are rather more hits this time.‡
I will next start with a simple exploration of how the electron density on I2 changes when it accepts an electron from a donor D (ωB97XD/Def2-TZVPP-PP calculation). The following is an electron density difference isosurface (0.002au) showing how the density changes. The red phase is increased density, which adds exo to the bond, and the blue is decreased density, mostly at the iodine atom but also in the centre of the bond. These changes have axial symmetry along the axis of the I-I bond.
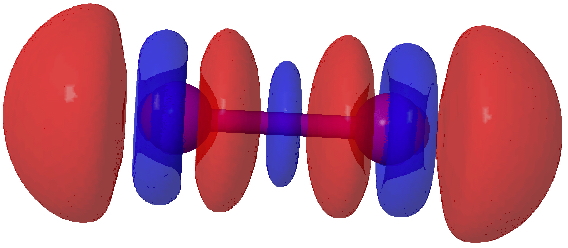
As usual, if you want to view a 3D model of this surface, click on the graphic above.
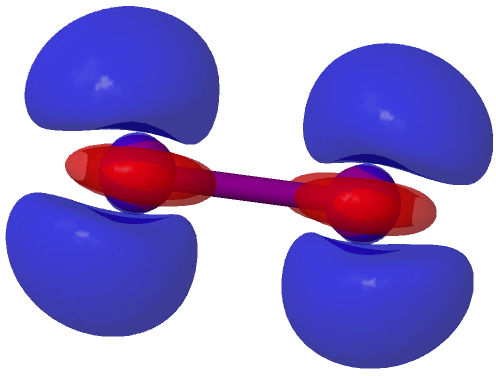
This next difference map shows the inverse, i.e. what happens when an electron is removed from I2 to form a radical cation. Again blue shows decreased density, and this is not axially symmetric, coming from the π-system (more specifically just one of the π-MOs; the orthogonal π-manifold actually gains red density). This is a nice way of showing that I2 accepts electrons into the σ-manifold and looses them from the π-manifold. In other words, the density responds in a very anisotropic way to addition or loss of electrons.†
In part 2, I will focus on one of the examples, HEKZOO[1] as published in 2012[2]. This is a complex between the base DABCO and molecular iodine, in which the DABCO donates electrons into that I2 σ-manifold.
‡There are only three significant hits with D=di-alkyloxygen rather than nitrogen. The first two[3],[4] involve X-A=I-I with a D…X distance of 2.8Aring; and the third X-A=Cl-Cl.
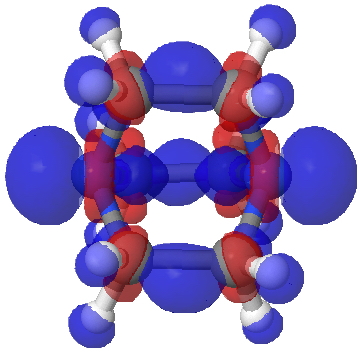
†I have now added also the density difference map for the base DABCO as a model for the donor D. Note that for this base, when an electron is lost to form the radical cation, the density reduces not just at the nitrogen lone pairs, but also the adjacent C-C bonds.
This post is the first I have written since hearing the very sad news about the death of Paul Schleyer. He was a frequent commentator on these posts, and his towering presence over the last sixty years in chemistry will be sorely missed.
-
Henry Rzepa is Emeritus Professor of Computational Chemistry at Imperial College London.
View all posts
References
- Peuronen, A.., Valkonen, A.., Kortelainen, M.., Rissanen, K.., and Lahtinen, M.., "CCDC 879935: Experimental Crystal Structure Determination", 2013. https://doi.org/10.5517/ccyjn03
- A. Peuronen, A. Valkonen, M. Kortelainen, K. Rissanen, and M. Lahtinen, "Halogen Bonding-Based “Catch and Release”: Reversible Solid-State Entrapment of Elemental Iodine with Monoalkylated DABCO Salts", Crystal Growth & Design, vol. 12, pp. 4157-4169, 2012. https://doi.org/10.1021/cg300669t
- H. Bock, and S. Holl, "CCDC 147854: Experimental Crystal Structure Determination", 2001. https://doi.org/10.5517/cc4yvhd
- Walbaum, C.., Pantenburg, I.., and Meyer, G.., "CCDC 837899: Experimental Crystal Structure Determination", 2012. https://doi.org/10.5517/ccx3x0x
Related
Tags: crystal structure search, D. Note, frequent commentator, Paul Schleyer
This entry was posted on Saturday, November 29th, 2014 at 9:48 am and is filed under crystal_structure_mining, Interesting chemistry, reaction mechanism. You can follow any responses to this entry through the RSS 2.0 feed.
You can leave a response, or trackback from your own site.
Halogen bonds: Part 1.
Halogen bonds are less familiar cousins to hydrogen bonds. They are defined as non-covalent interactions (NCI) between a halogen atom (X, acting as a Lewis acid, in accepting electrons) and a Lewis base D donating electrons; D….X-A vs D…H-A. They are superficially surprising, since both D and X look like electron rich species. In fact the electron distribution around X-X (A=X) is highly anisotropic, with the electron rich distribution (the "donor") being in a torus encircling the bond, and an electron deficient region (the "acceptor") lying along the axis of the bond.
I will start this simple exploration of halogen bonds by a crystal structure search, defined as below, where A in the above definition is also any halogen, the donor D is a tri-alkyl nitrogen donating via a lone pair, the green contact is defined as an intermolecular distance equal to or shorter than the sum of the van der Waals radii together with an angle subtended as N…7A…7A.
The result of such a search is shown below:
There are surprises.
This next search replaces A with a carbon instead of a halogen. The hot-spot moves to ~2.8Å, still much shorter than the combined van der Waals radii, and there are rather more hits this time.‡
I will next start with a simple exploration of how the electron density on I2 changes when it accepts an electron from a donor D (ωB97XD/Def2-TZVPP-PP calculation). The following is an electron density difference isosurface (0.002au) showing how the density changes. The red phase is increased density, which adds exo to the bond, and the blue is decreased density, mostly at the iodine atom but also in the centre of the bond. These changes have axial symmetry along the axis of the I-I bond.
As usual, if you want to view a 3D model of this surface, click on the graphic above.
This next difference map shows the inverse, i.e. what happens when an electron is removed from I2 to form a radical cation. Again blue shows decreased density, and this is not axially symmetric, coming from the π-system (more specifically just one of the π-MOs; the orthogonal π-manifold actually gains red density). This is a nice way of showing that I2 accepts electrons into the σ-manifold and looses them from the π-manifold. In other words, the density responds in a very anisotropic way to addition or loss of electrons.†
In part 2, I will focus on one of the examples, HEKZOO[1] as published in 2012[2]. This is a complex between the base DABCO and molecular iodine, in which the DABCO donates electrons into that I2 σ-manifold.
‡There are only three significant hits with D=di-alkyloxygen rather than nitrogen. The first two[3],[4] involve X-A=I-I with a D…X distance of 2.8Aring; and the third X-A=Cl-Cl.
†I have now added also the density difference map for the base DABCO as a model for the donor D. Note that for this base, when an electron is lost to form the radical cation, the density reduces not just at the nitrogen lone pairs, but also the adjacent C-C bonds.
This post is the first I have written since hearing the very sad news about the death of Paul Schleyer. He was a frequent commentator on these posts, and his towering presence over the last sixty years in chemistry will be sorely missed.
Author
Henry Rzepa is Emeritus Professor of Computational Chemistry at Imperial College London.
View all postsReferences
Share this:
Related
Tags: crystal structure search, D. Note, frequent commentator, Paul Schleyer
This entry was posted on Saturday, November 29th, 2014 at 9:48 am and is filed under crystal_structure_mining, Interesting chemistry, reaction mechanism. You can follow any responses to this entry through the RSS 2.0 feed. You can leave a response, or trackback from your own site.